.svg)
Analytics that prove impact and guide action.
Empower data-driven team to see what’s working across sourcing and engagement — and where to focus next. Connect activity, adoption, and outcomes to make sharper talent decisions.
Reduce external sourcing costs by 50%.

It’s hard to see what’s actually working.
Sourcing data lives across disconnected tools, making it difficult to compare inbound, rediscovered, referral, alumni, and outbound efforts in one place.
Adoption is difficult to assess early.
Teams often rely on assumptions to gauge whether new workflows are being used well. Without early visibility, it’s hard reinforce or scale best practices.
Outreach results vary without explanation.
Reply and interest rates differ by recruiter, team, role, and region. Without shared visibility, teams fall back on guesswork instead of learning which tactics drive engagement.
Shallow signals
Most AI relies on thin inputs like resumes and keywords. It can’t identify warm relationships or trusted connections, which means it’s working with an incomplete picture.
Clarity to guide every decision.
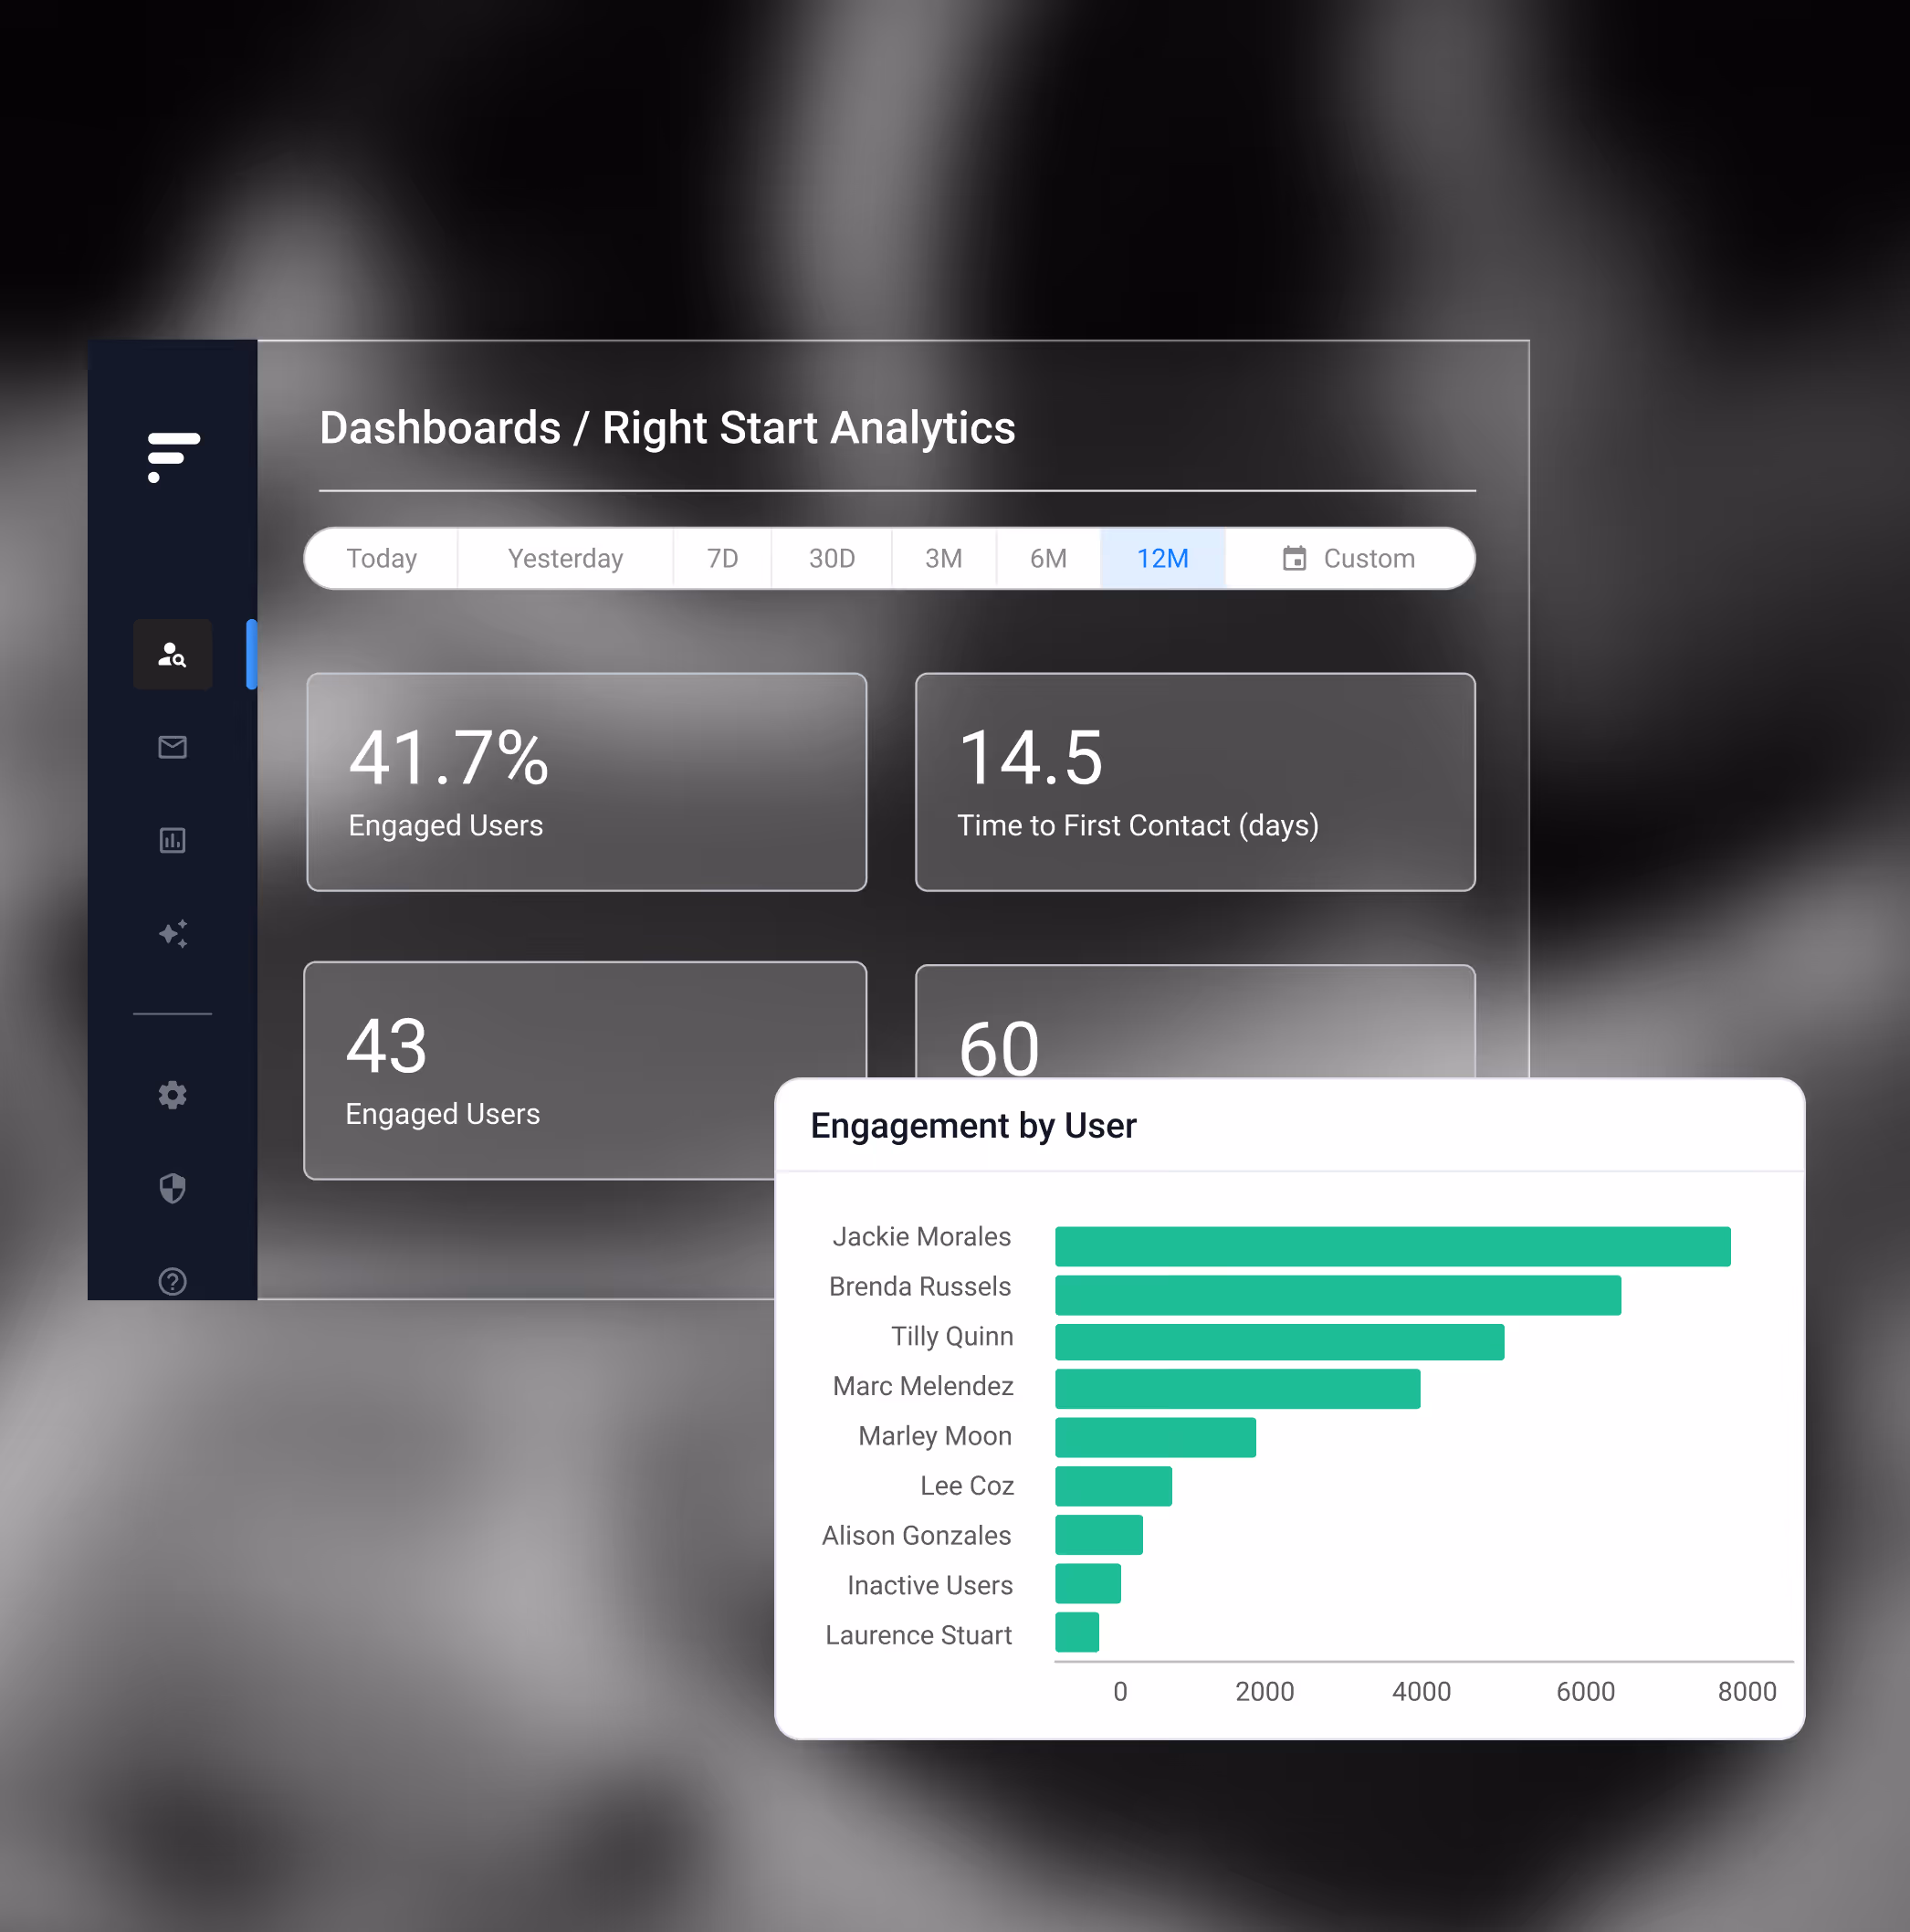
Set teams up for success with right start analytics.
See how teams are using Findem from the moment they onboard. Right start analytics surface early activity like searches created, campaigns launched, and time to first outreach, giving leaders visibility into what’s working and where teams need support.
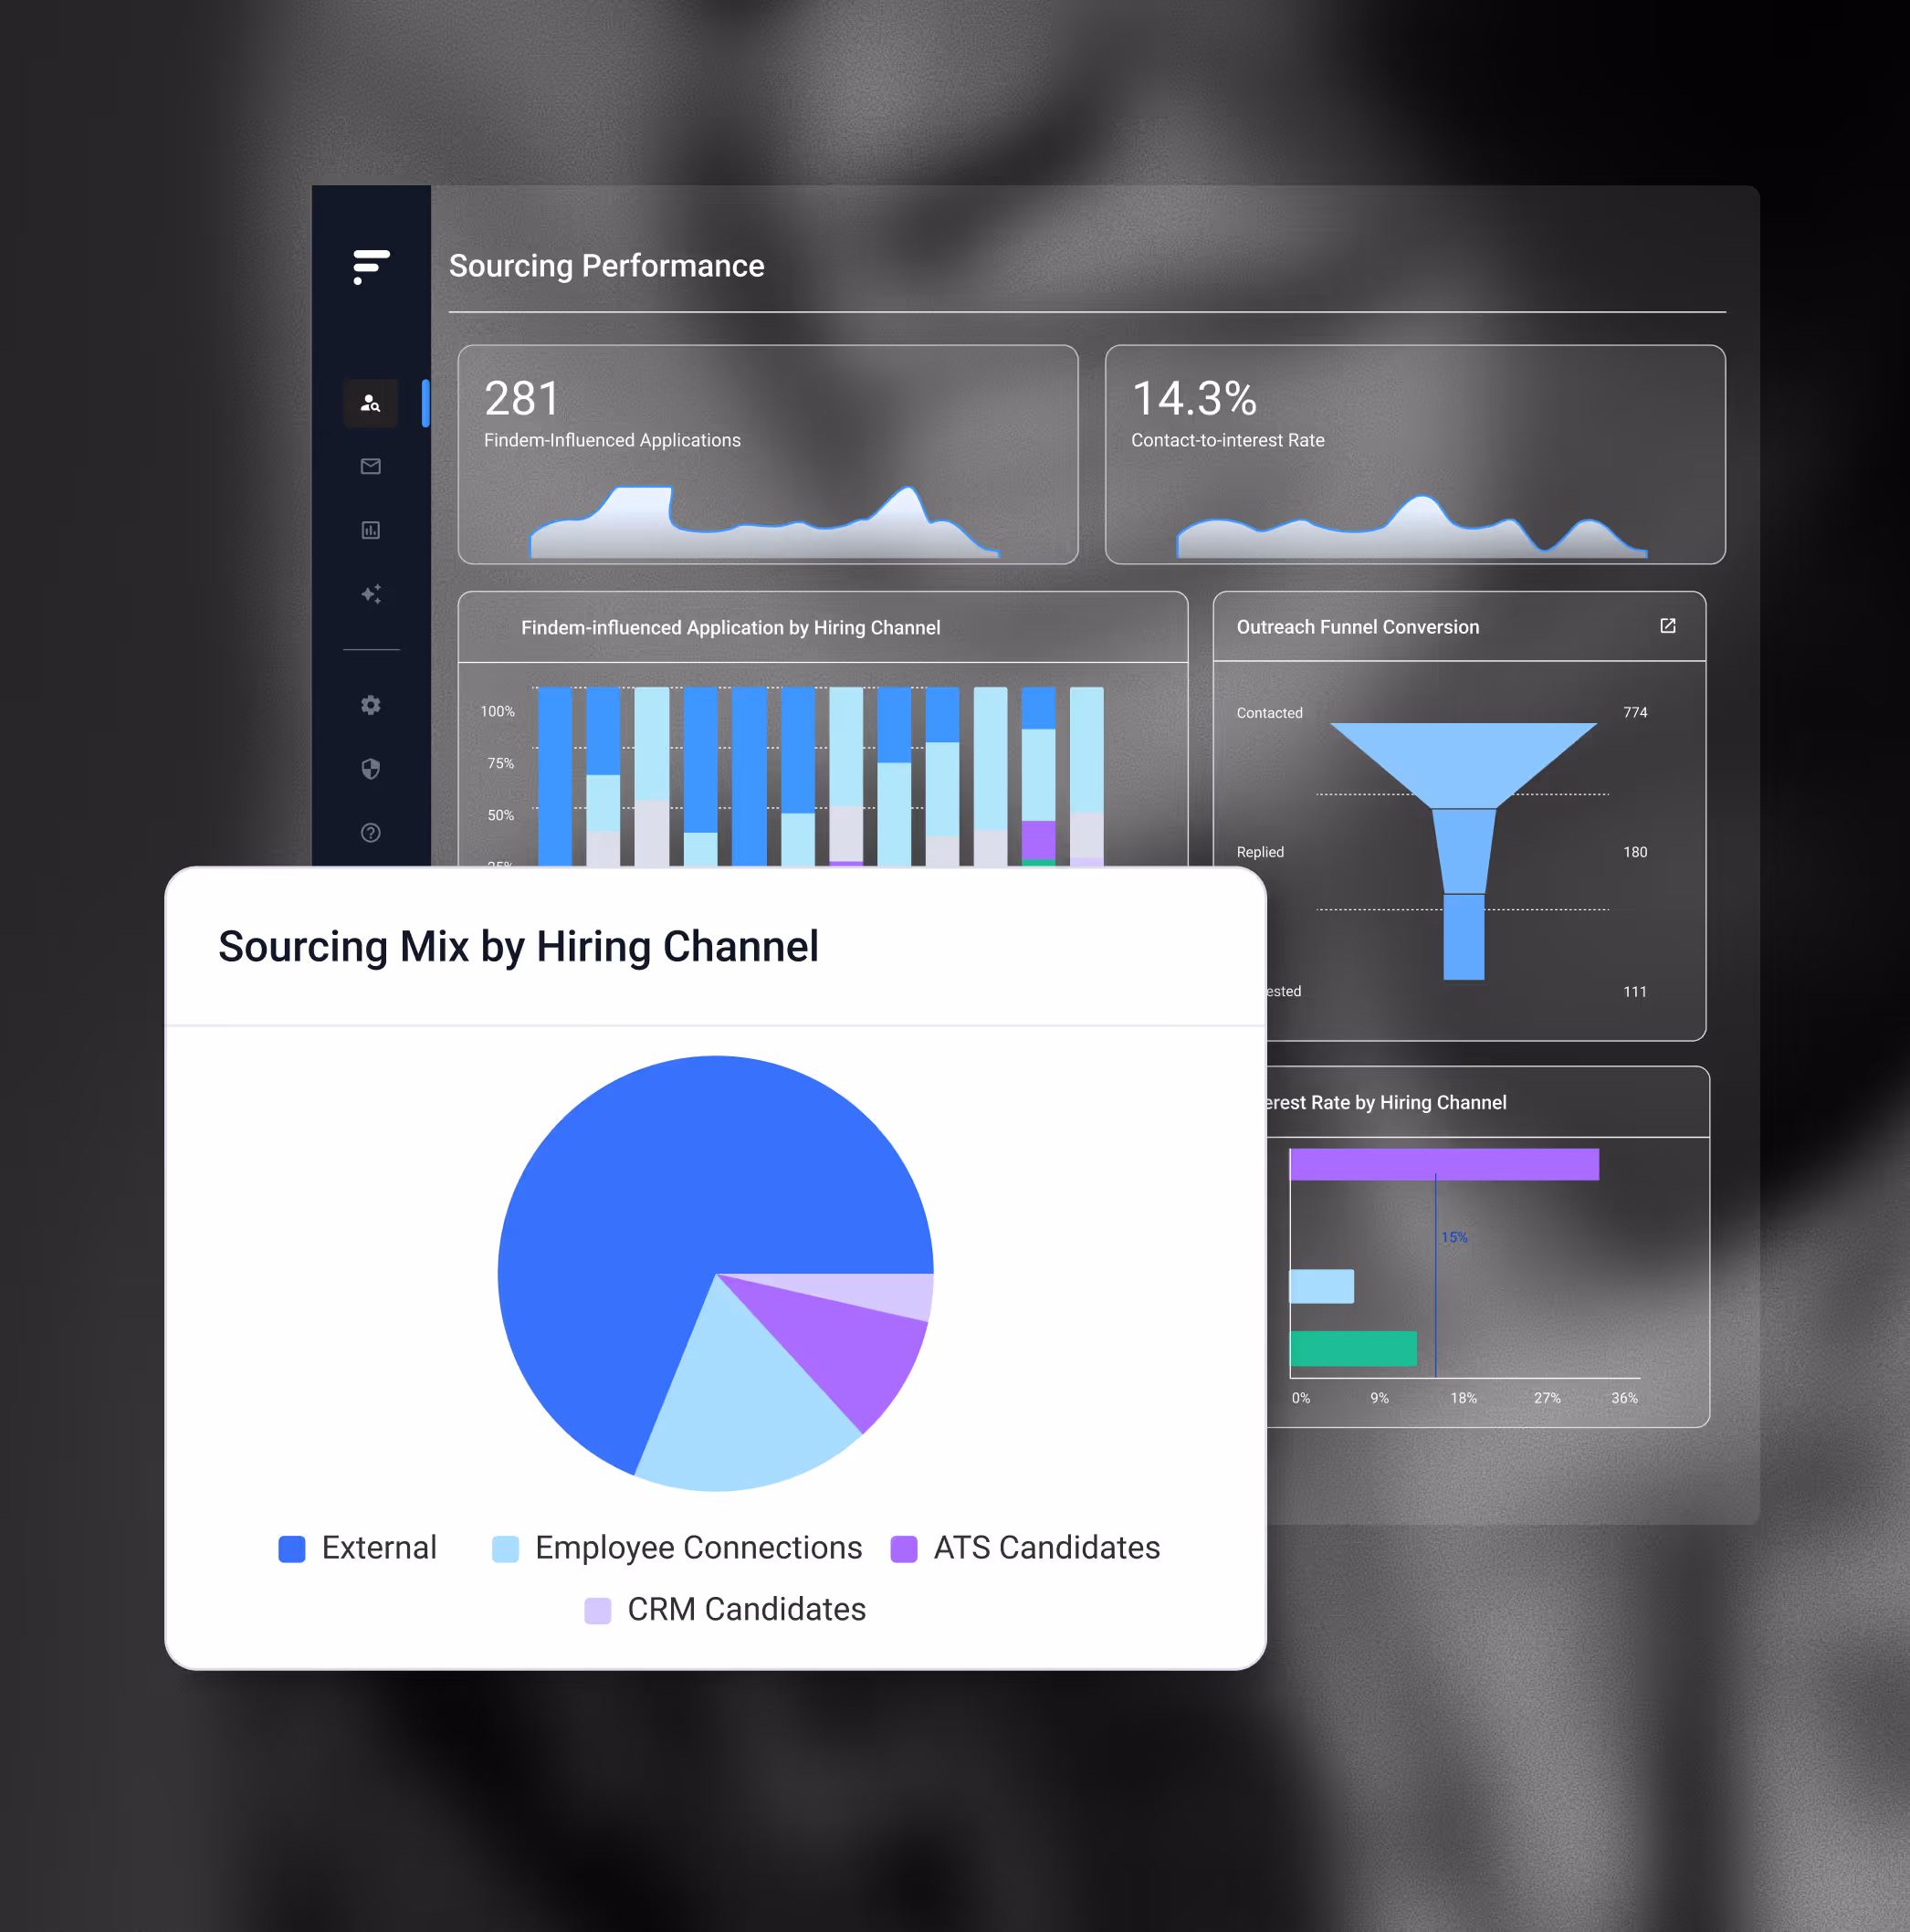
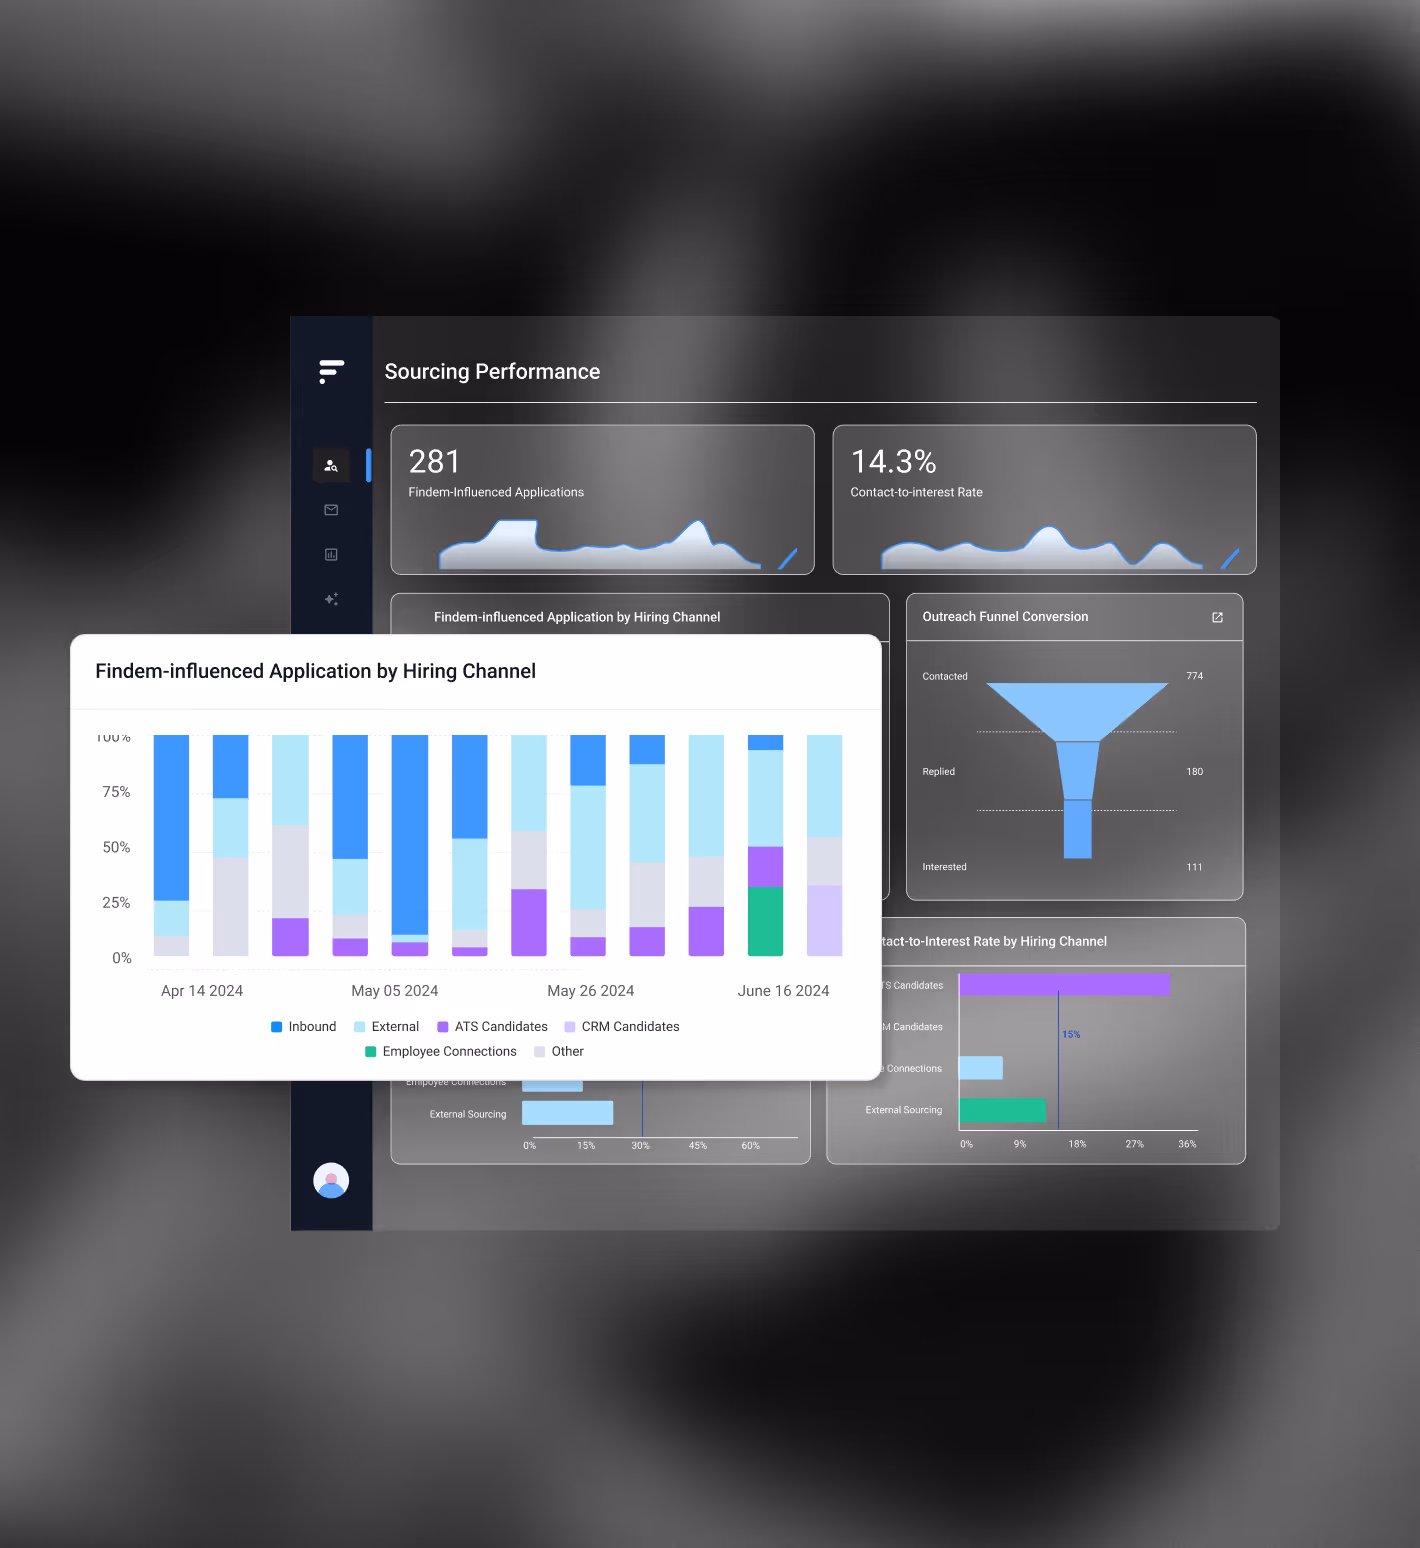
Uncover channel performance and utilization in one view.
Compare performance across every sourcing channel, including inbound, ATS rediscovery, referrals, employee connections, alumni, and external search. Analytics show which channels generate engagement, interest, and applications — helping leaders shift effort and budget toward the approaches that consistently move candidates forward.
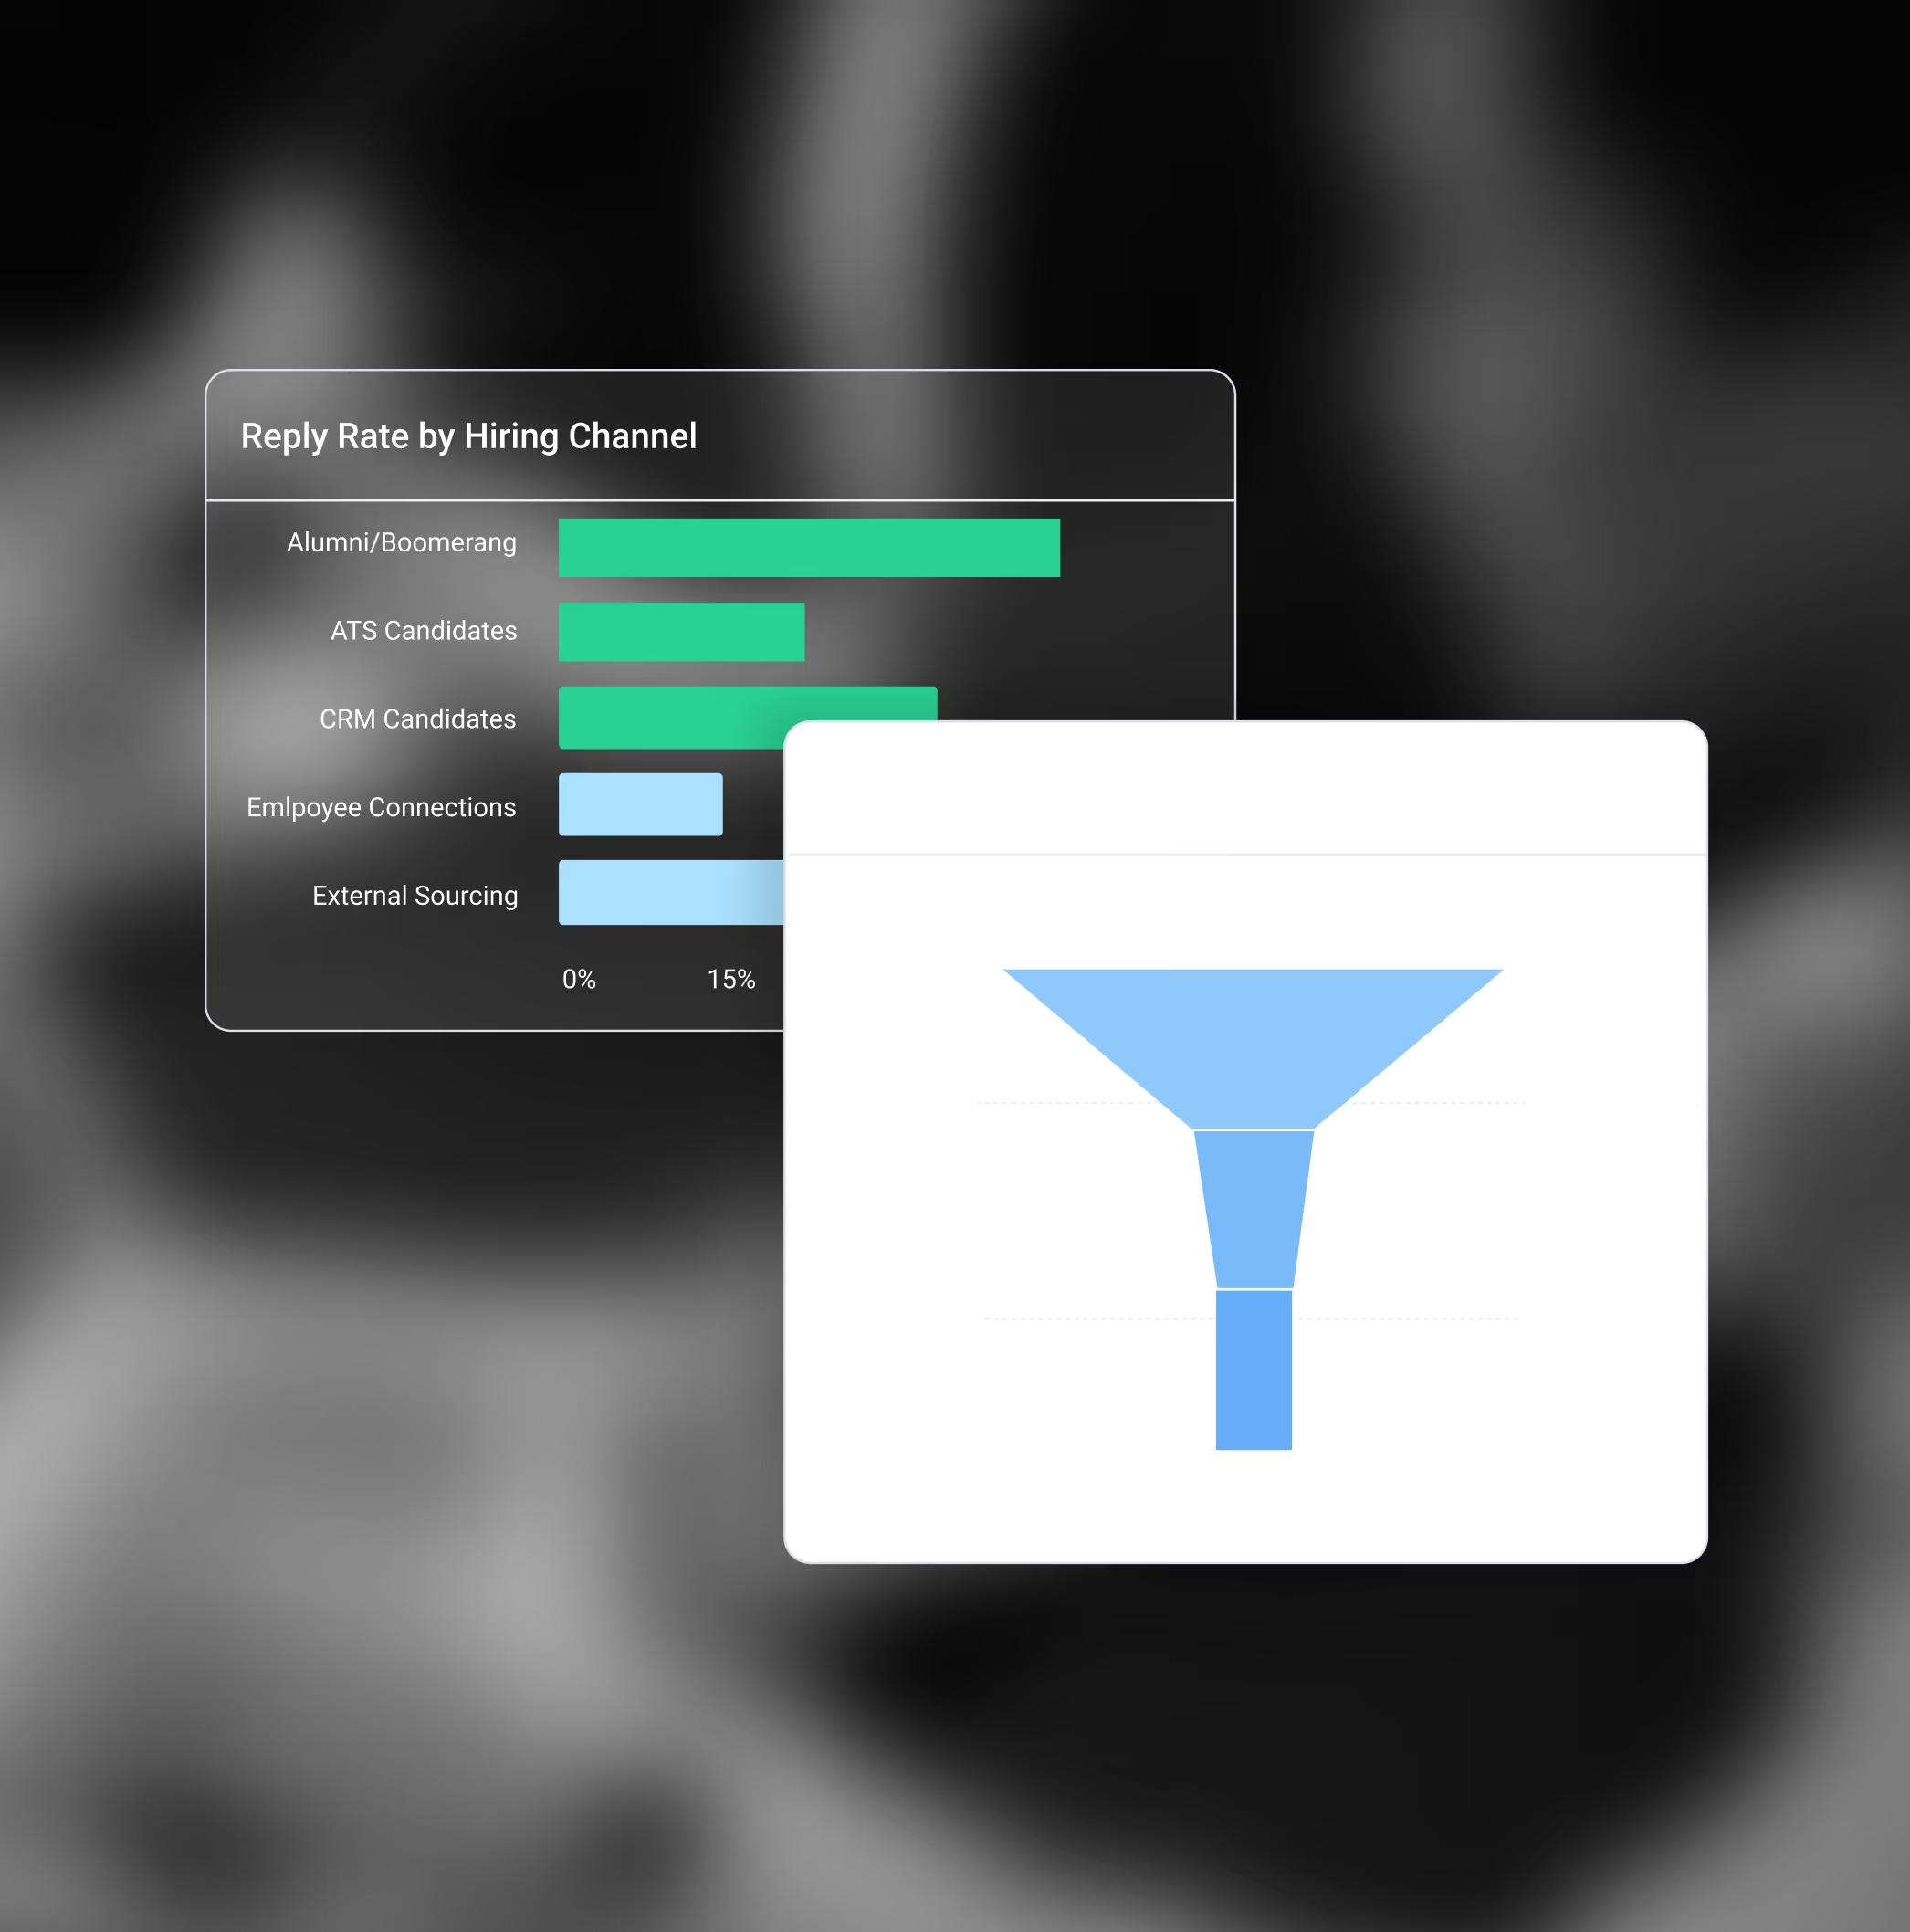
See what moves candidates with outreach analytics.
Understand how candidates respond across campaigns with visibility into reply rate, interest rate, and time to reply. Compare outcomes by recruiter, role, team, and location to identify which messages and tactics resonate.
"Analytics essentials takes the guesswork out of what we need to focus on. It's an invaluable tool for optimizing our efforts."
Brenna Schnaare, Program Manager, TA Experience

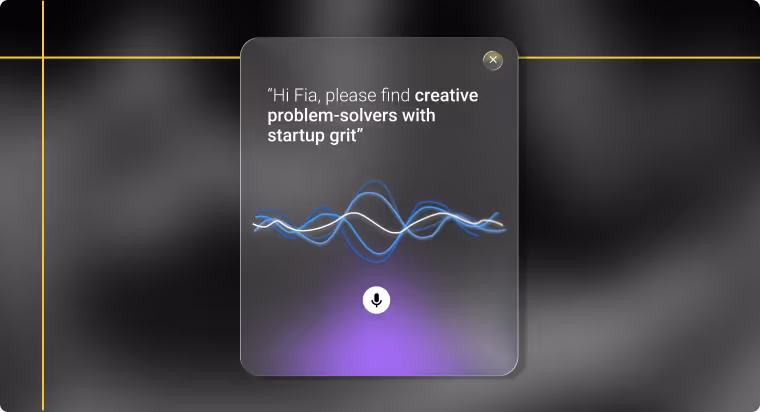
Meet Fia, your personal recruiting assistant.
Skip the clicks and get straight to action. Be among the first to use Fia, the agentic voice and chat assistant for talent teams.

Frequently asked questions.
Who is Analytics designed for? Recruiters or leaders?
Analytics is built for both. Recruiters gain clarity into what works, while talent leaders get the visibility needed to coach teams, align on best practices, and make informed decisions about where to invest time and budget.
Can Analytics help reduce reliance on external sourcing?
Yes. By showing how inbound, rediscovered candidates, referrals, and warm networks perform relative to paid sourcing, Analytics helps teams shift effort toward channels that deliver stronger results and better return over time.
What sourcing and outreach insights does Analytics provide?
Analytics brings channel performance, outreach response, and pipeline movement into one view. Leaders can understand which channels drive engagement, where candidates drop off, and which outreach approaches consistently move talent forward.
What does “Right start analytics” mean in practice?
Right start analytics give leaders early visibility into how teams are using Findem from day one. Instead of waiting months for lagging outcomes, leaders can see whether workflows are taking hold, coach where needed, and reinforce best practices early.
How is Findem Analytics different from ATS reporting or BI dashboards?
ATS reports and BI tools show what happened after the fact. Analytics are designed to guide action while work is happening — helping leaders see early adoption, compare sourcing effectiveness, and improve outreach before inefficiencies scale.

See people in higher resolution.